Nice graphs for all sensors
TL;DR, skip the whole bla bla rant and jump directly to the TimescaleDB part
I wanted to have some nice graphs for Home Assistant like I already did once where I got the Temperature values via SDR from a few sensors broadcasting the temperature via radio which was then pushed via MQTT to a NodeRed running on a Pi. What I did not want to do however is to create something in NodeRed for every sensor I have in the house. I just want it to work for all existing and future sensors. I stumbled over Oliver Hilsky’s Blog Post showing exactly what I wanted to accomplish, you install InfluxDB, add a few of lines of YAML to Home Assistant and you’re done.
Me and InfluxDB do not get along
My only issue was that I’m not a fan of InfluxDB, not that something is wrong with it or it doesn’t have a use case, but for the things I need I always had issues with not wanting to learn how to query data or think about retentions and things like that because they are not relevant for me in this case, and this image from https://howfuckedismydatabase.com/ says it all.

But, I wanted to give it a shot and just wanted to get it running.
InfluxDB on Home Assistant not working
The InfluxDB addon on Home Assistant seems to not be working, it installs but does not start up, in addition to that it shows that it’s not been maintained anymore since 2021. It’s much simpler to just update an external docker container than having to mess around with a Home Assistant add-on. So I just went with the external installation. This is easy to accomplish with docker-compose but I faced the issue that when creating a new bucket I was placed exactly in that position of choosing a retention period. I don’t know, I don’t care, I just want graphs, and let me deal with some cleanup later. At this point, I decided to just abandon the idea of InfluDB.
TimescaleDB to the rescue
I like PostgreSQL, I know SQL, so why not just use TimescaleDB for this task? As it seems I’m not the only one with this idea, there is an addon for Home Assistant to install TimescaleDB but I decided to go with an external installation of TimescaleDB instead and create a docker-compose containing both TimescaleDB and Grafana.
The docker-compose file
version: "3.4"
services:
  grafana:
    image: grafana/grafana
    container_name: grafana
    restart: always
    ports:
      - 13000:3000
    networks:
      - monitoring
    volumes:
      - /opt/docker/home-assistant/grafana:/var/lib/grafana
  timescaledb:
    image: timescale/timescaledb-ha:pg14-latest
    restart: always
    ports:
      - 15432:5432
    environment:
      POSTGRES_PASSWORD: ${POSTGRES_PASSWORD}
    volumes:
      - /opt/docker/home-assistant/timescaledb:/home/postgres/pgdata
    networks:
      - monitoring

networks:
  monitoring:
Some important things about the compose file.
- Update the ports to match your needs, here grafana is reachable via 13000 and TimescaleDB via 15432
- For some reason TimescaleDB, or at least
timescaledb-ha, places the database files under/home/postgres/pgdata/datainstead of the usual Postgresql/var/lib/postgresql/data, this is new to me, I tried Timescale earlier and this was not the case. It did cause me to use my first minutes of data due to this.
Start up everything and then it’s time to create the database.
Create the database
Execute a shell in the container and start psql
docker-compose run timescaledb /bin/bash
$ psql
postgres=# CREATE database homeassistant;
CREATE DATABASE
postgres=# \c homeassistant
You are now connected to database "homeassistant" as user "postgres".
homeassistant=# CREATE EXTENSION IF NOT EXISTS timescaledb;

NOTICE:  extension "timescaledb" already exists, skipping
CREATE EXTENSION
homeassistant=#
This was the database creation and the timescaledb extension.
Send data to timescale with ltss
To get all the data into TimescaleDB you need to install LTSS There is a more detailed instruction in the forum post by freol, I will just add the bare minimum to get it running.
Install ltss
I am assuming here that you already have HACS installed, if not, you need that first. This is outside the scope of this post.
Go to HACS Integrations
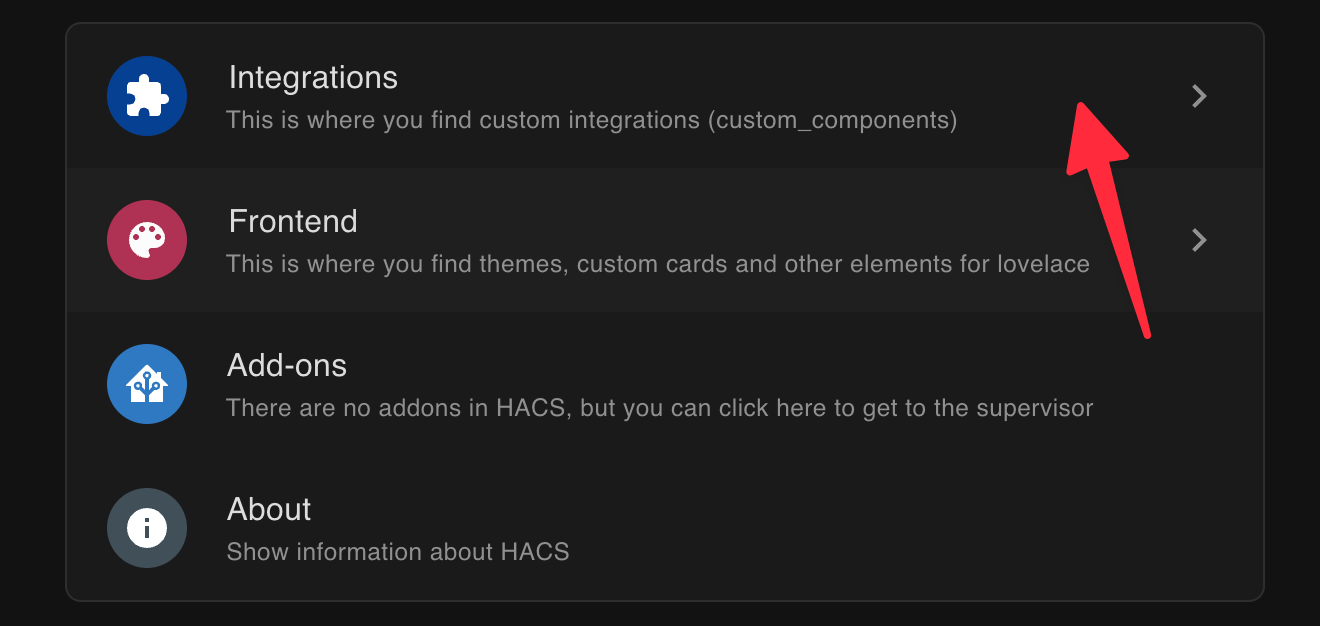
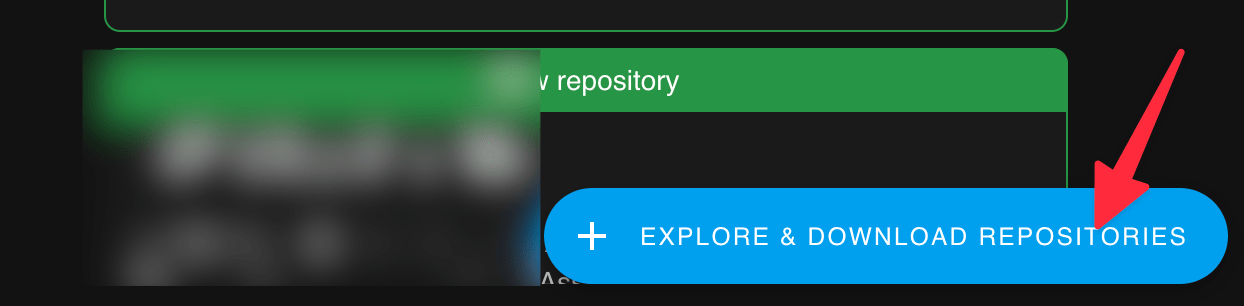
Click on Explore & Download repositories
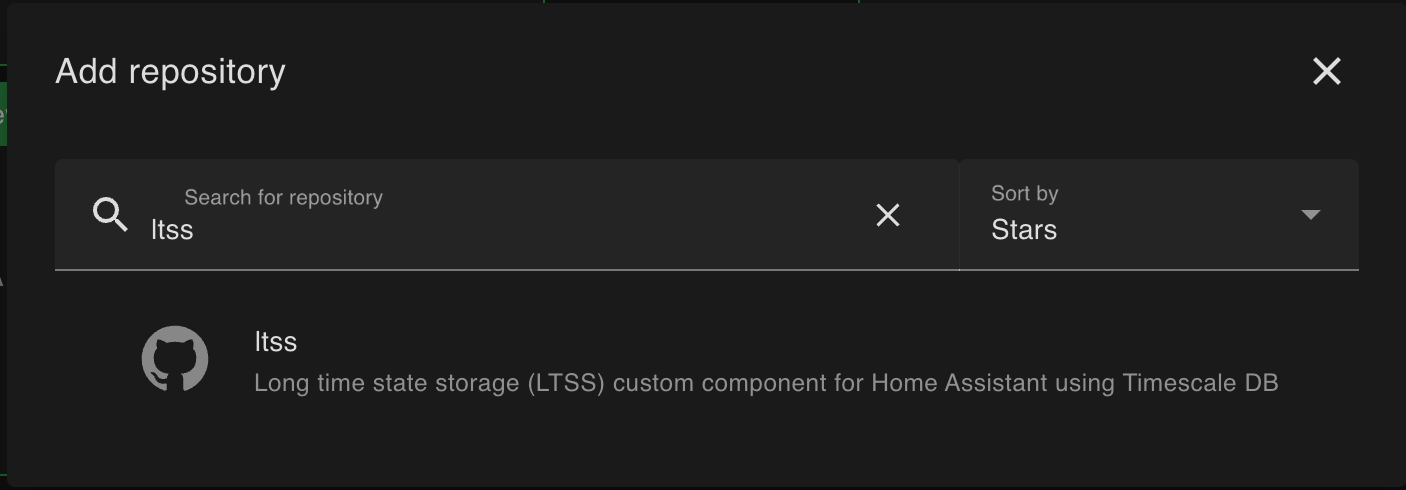
Search and add the ltss repository
Once it’s installed, restart your Home Assistant.
Configure connection to TimescaleDB
Whip up your favorite editor (which of course must be vi) and edit config/configuration.yaml
adding these lines of YAML and fixing the password, DBSERVER, and port to your
environments.
ltss:
  db_url: postgresql://postgres:****@DBSERVER:port/homeassistant
  include:
    domains:
    - sensor
It’s very important to use a privileged user (like postgres) for the first start since ltss needs to install extensions, after the initial startup you can change to a non-privileged user. Validate your configuration and restart Home Assistant once more. While it’s starting up you can watch the database being populated.
homeassistant=# \d
                List of relations
 Schema |       Name        |   Type   |  Owner
--------+-------------------+----------+----------
 public | geography_columns | view     | postgres
 public | geometry_columns  | view     | postgres
 public | ltss              | table    | postgres
 public | ltss_id_seq       | sequence | postgres
 public | spatial_ref_sys   | table    | postgres
(5 rows)
That’s it! Your Home Assistant is now sending all sensor data to the TimescaleDB. Time to get started with Grafana.
Grafana
Configure Grafana
The installation was already done via docker-compose, visit the Grafana installation with your browser of choice and start adding a new data source.
Select PostgreSQL as the source for Grafana and configure it like this:
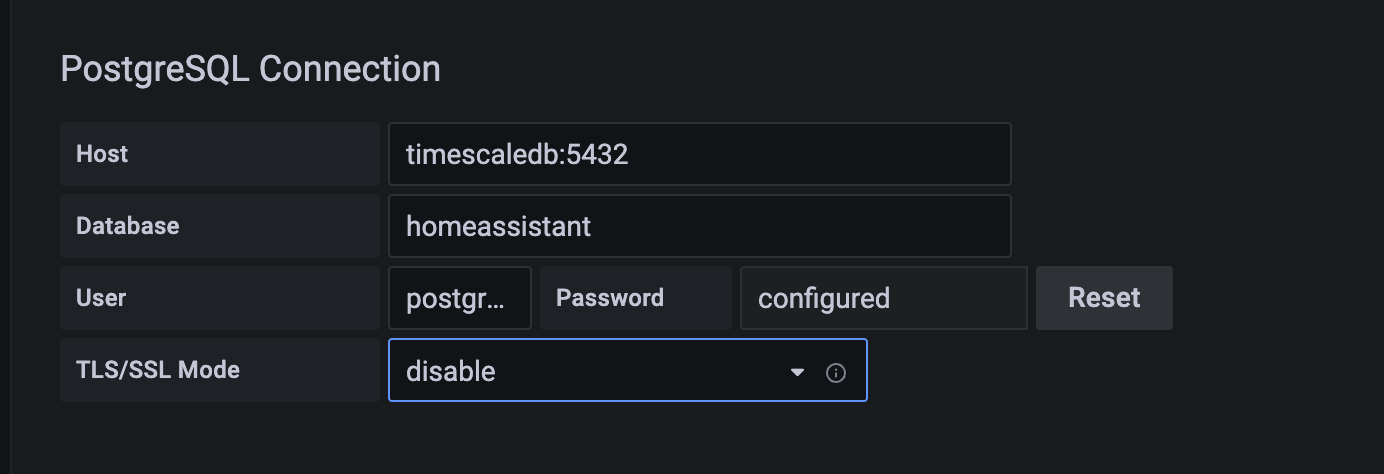
Please note that the host is timescaledb:5432, since it’s running on the
same network in docker, it can reach it with the hostname timescaledb and on
the port 5432 and not the exposed 15432 port. I also disabled TLS in this case.
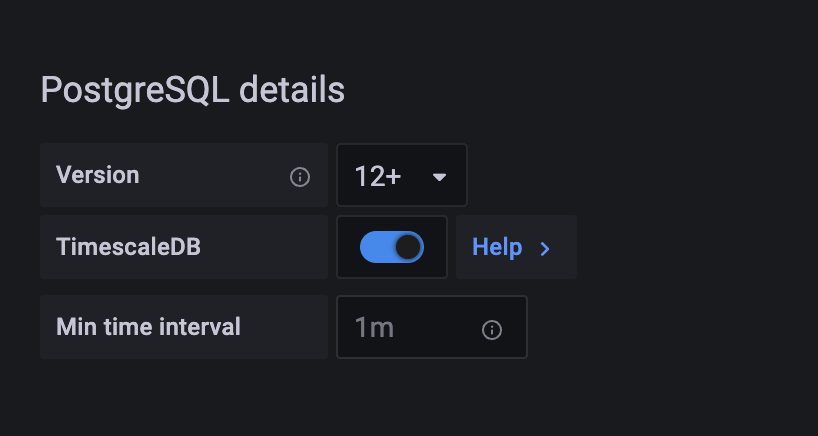
Next, scroll down and make sure to select the correct version and enable the TimescaleDB setting.
That’s it from the Grafana connection part, now let’s build some dashboards.
Setup Dashboard
To get an idea, this is my first dashboard.
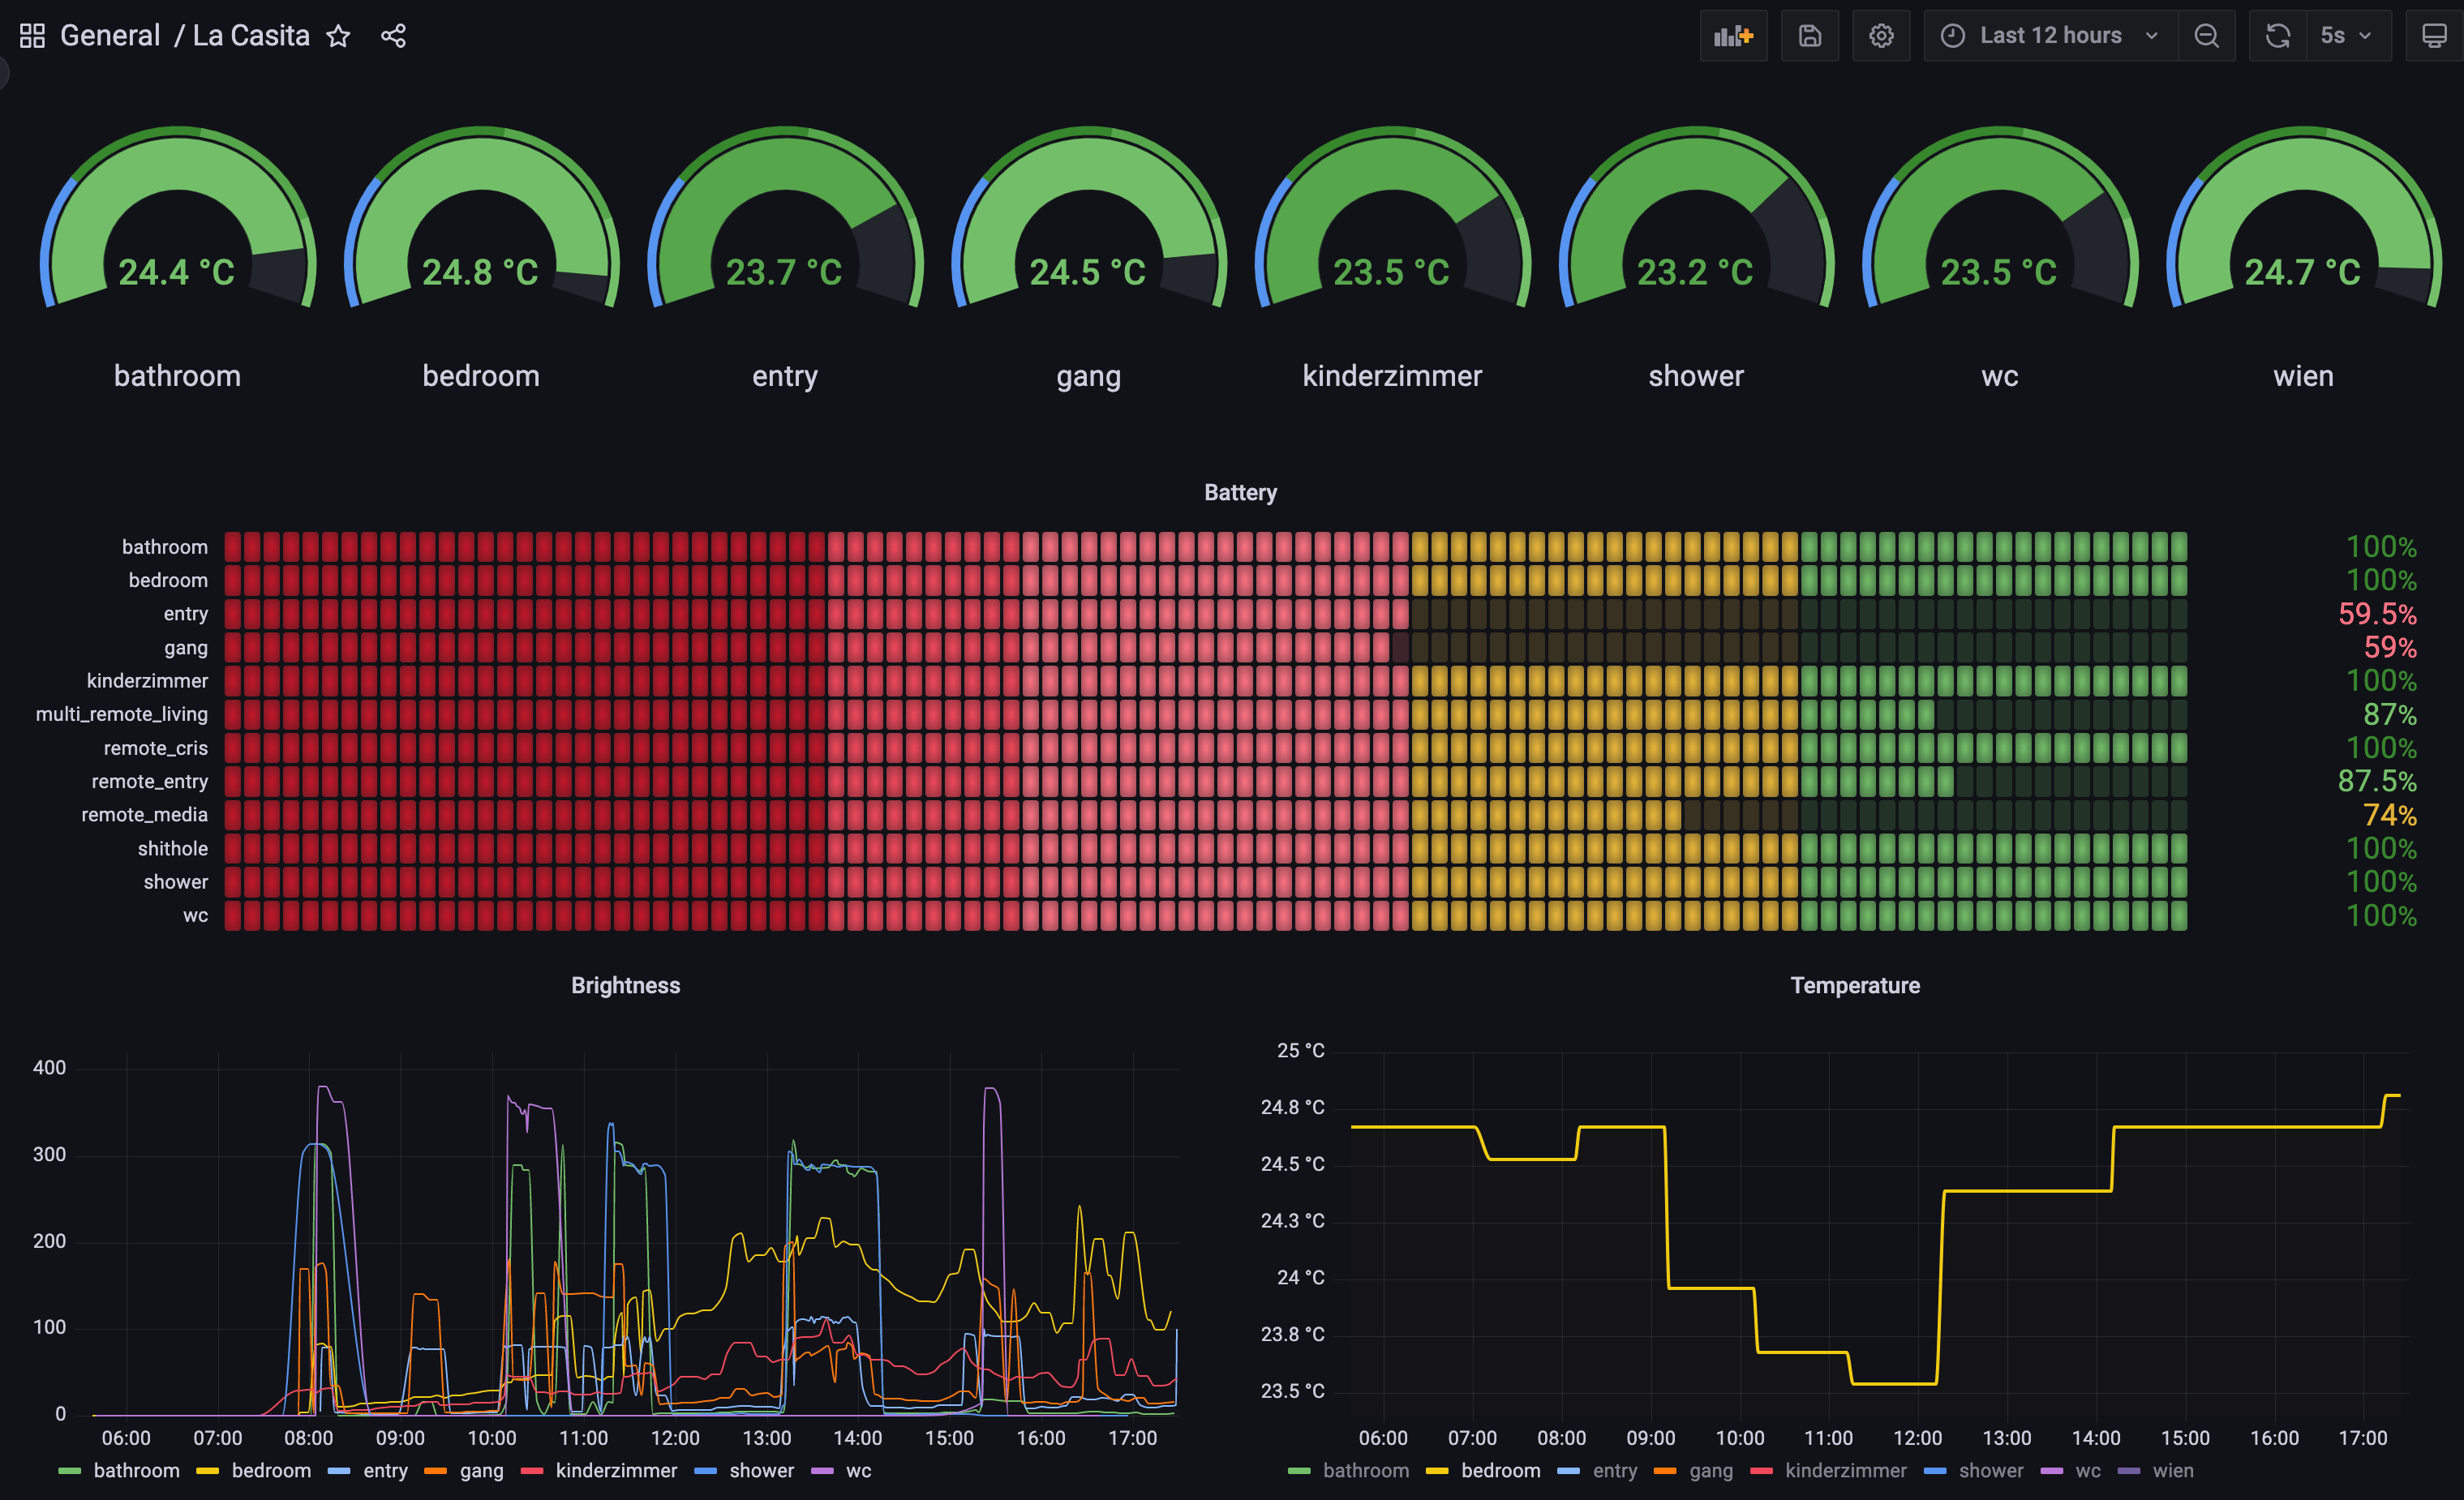
And if you are asking yourself what “shithole” is supposed to be, that’s the junk room full of crap I forgot about, yes I even have a motion sensor there, stop judging me! And yes, my kids have been watching too much Encanto, hence the smart-home had to be named “La Casita”, I was not allowed to call it “E-Corp”.
I will let you build your own dashboard, just want to give a few tips along the way.
ltss state is a string, but grafana wants numbers
The first issue I encountered was that grafana is expecting numbers but ltss saves the state as a string. This makes sense if you look at the data where you have addresses of Geolocations as state or the SSID your phone was connected to and all other kinds of non-numerical values that Home Assistant uses. But all you have to do is let TimescaleDB typecast to decimal with
state::DECIMAL AS "value"
But you might come across a situation where you have a value of “None” as a battery state in the database. This is a problem as the SQL statement will give you an error. The simplest way for me was to just select the entries that have numbers in the state using regex.
WHERE state ~ '[0-9]{1,3}(?:.?[0-9]{0,3})'
This selects Integers or Decimal numbers with up to three digits after the comma.
Another issue I had was the long names like sensor.sensor_bedroom_battery
when all I wanted was to just have bedroom as the metric name in Grafana.
Again you can use PostgreSQL string replacements, I went with regex again.
SELECT
  REGEXP_REPLACE(REGEXP_REPLACE(entity_id, 'sensor.','','g'),'_battery','') AS "metric",
This replaces sensor. where . matches in regex also the _ which removes both
instances of sensor.sensor_
Now here’s the full SQL to select all Battery data from Grafana
SELECT
  $__timeGroupAlias("time",$__interval),
  REGEXP_REPLACE(REGEXP_REPLACE(entity_id, 'sensor.','','g'),'_battery','') AS "metric",
  state::DECIMAL AS "value"
FROM ltss
WHERE
  $__timeFilter(time) AND
  entity_id like '%battery' AND
  state ~ '[0-9]{1,3}(?:.?[0-9]{0,3})'
GROUP BY "time",2,3
ORDER BY 1,2
In my select statments, I used WHERE entity_id like '%battery' to get only
battery data and to get temperature data I used entity_id like 'sensor.%temperature', you get the idea.
Creating alerts
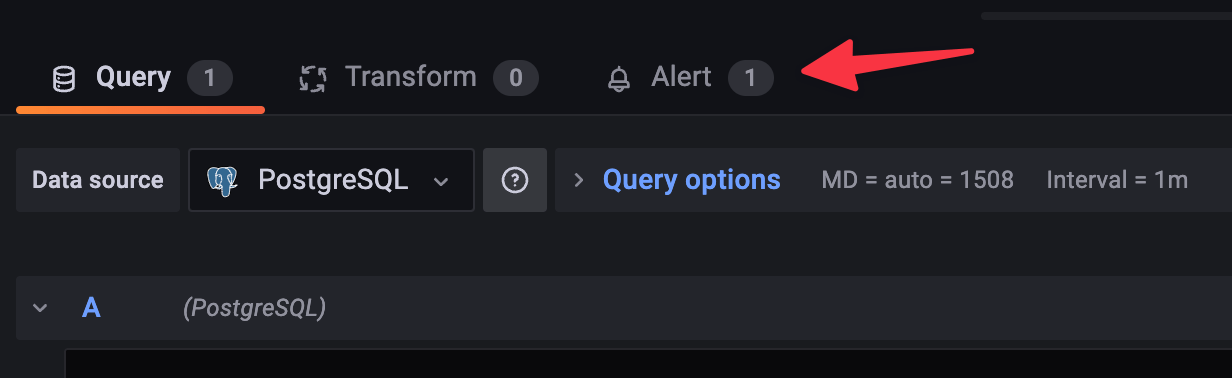
One more before I let you go. Having all this data in Grafana now could be used to set up some alerts. I will just show the basics since I have used the new Grafana alerts for the first time in this project. Before starting with the alerts, create a new folder in grafana as this will be a required selection in the alerting system without an option to create one during the alert creation. You also need to create a Time Series panel, the bar gauge, or any other type of panels won’t have the Alert tab in Grafana.
Clik on the alert tab.
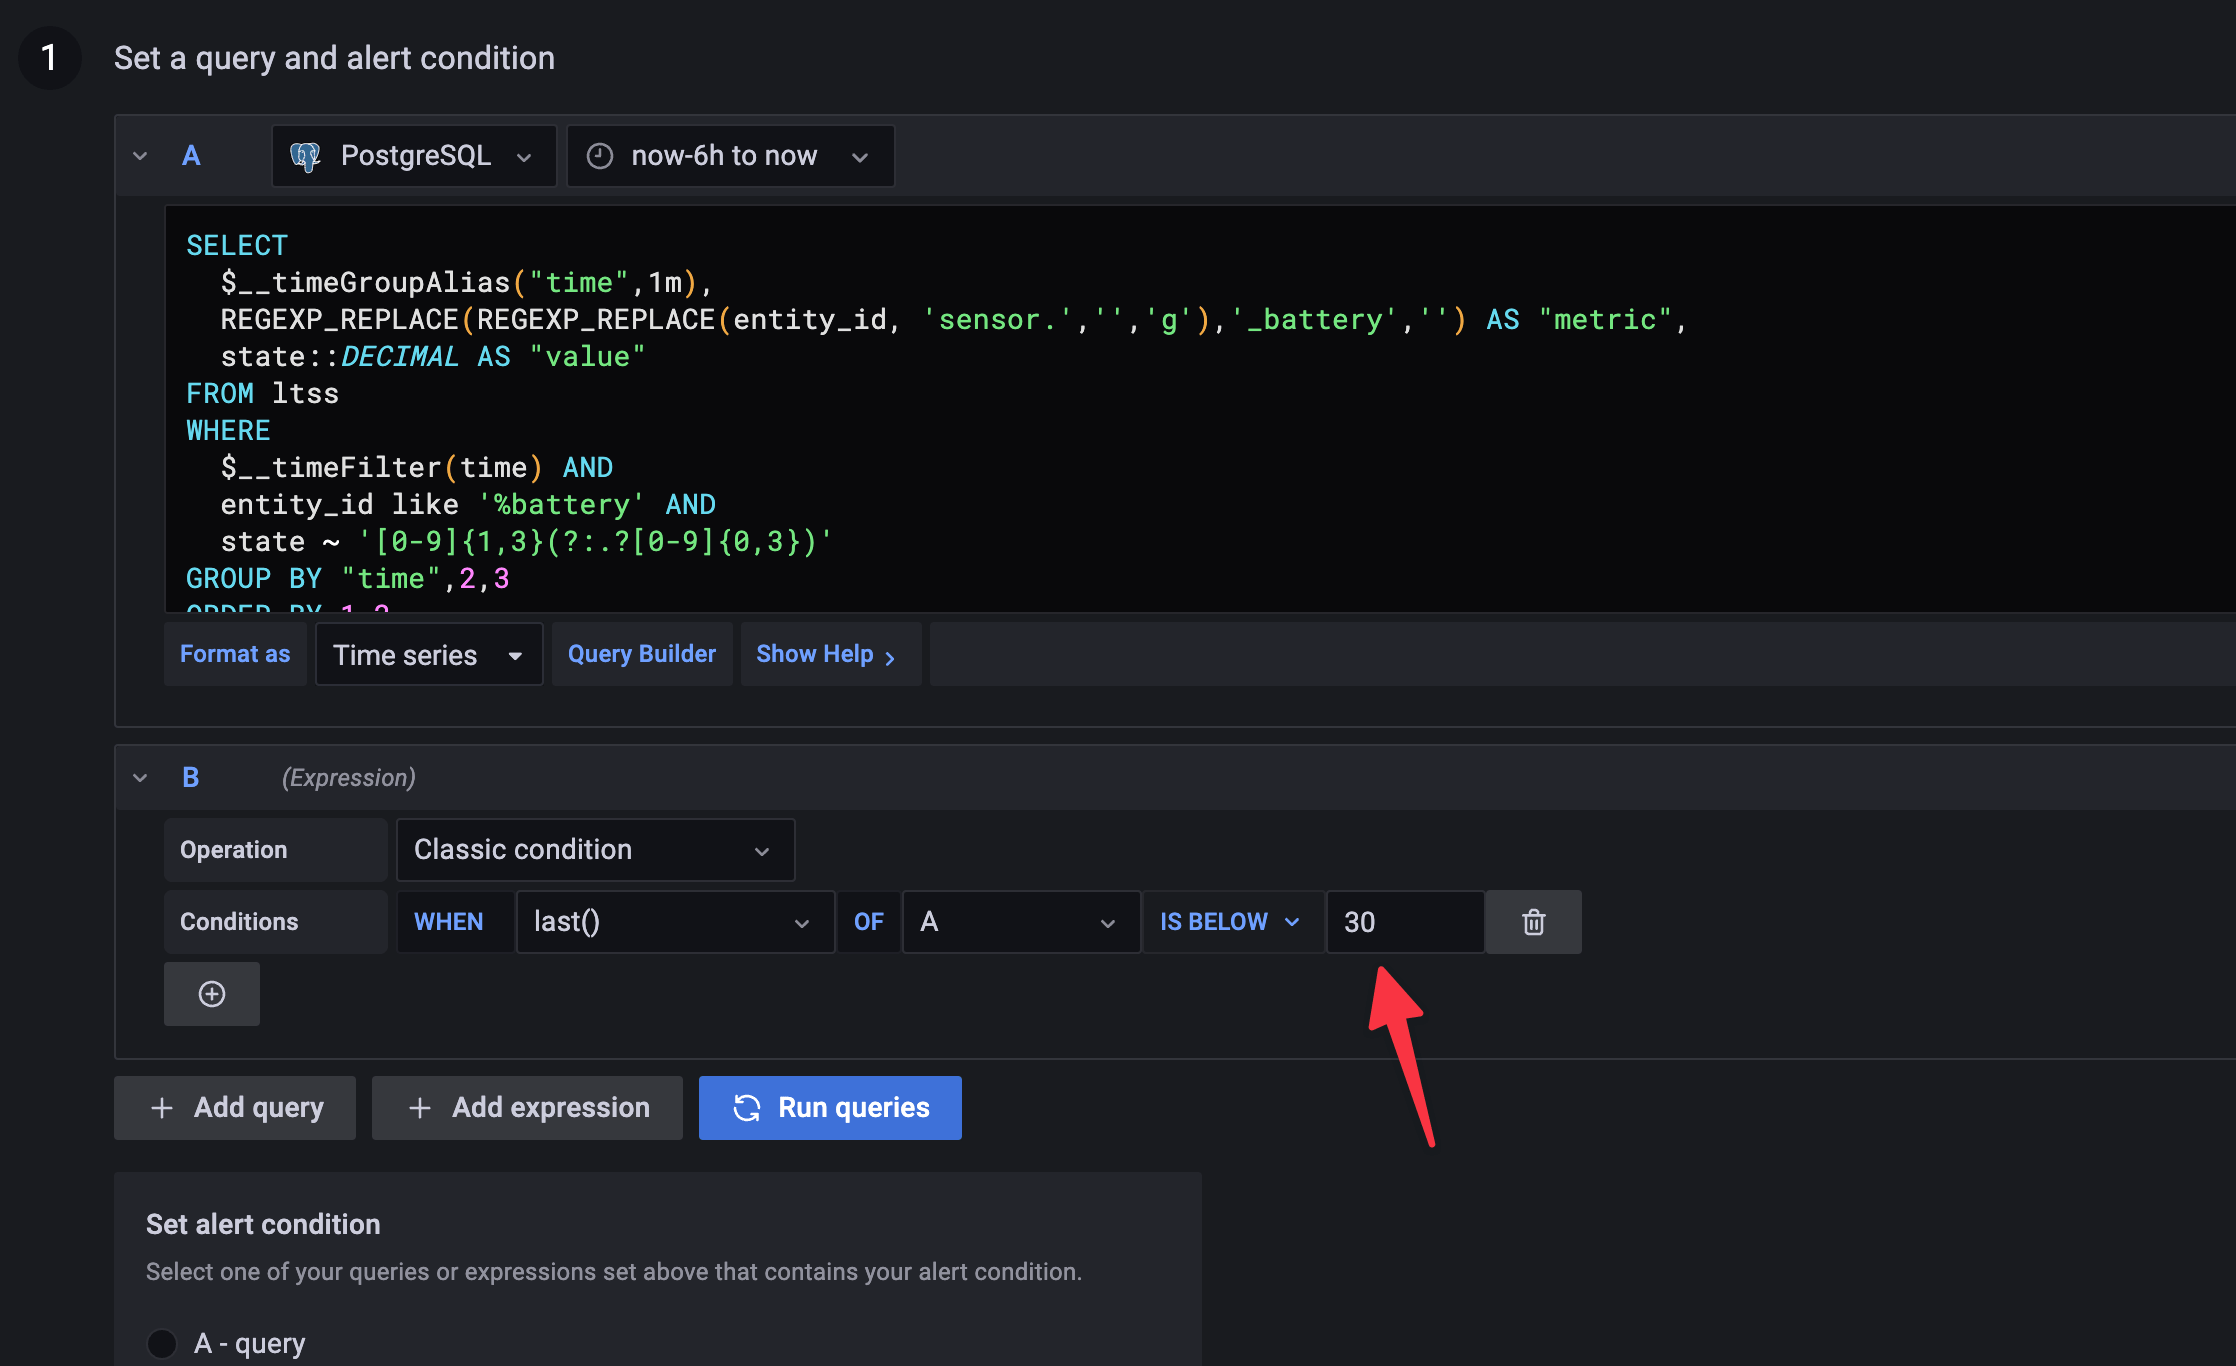
Set your condition, I used a value < 30 to trigger the alert.
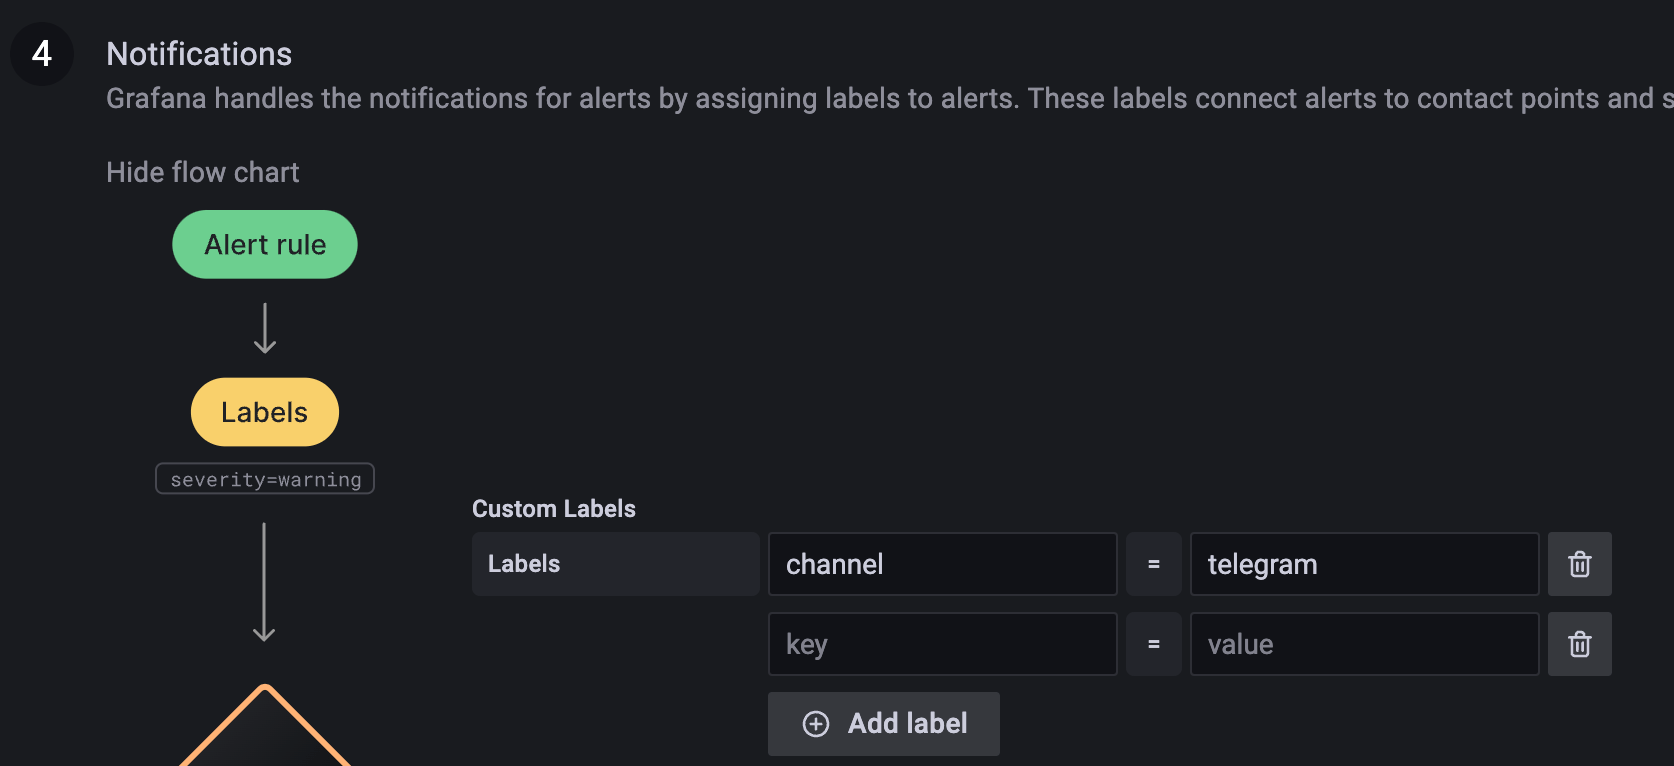
Define labels if you want, here I use the label channel with the value
telegram which allows me to send this alert via telegram.
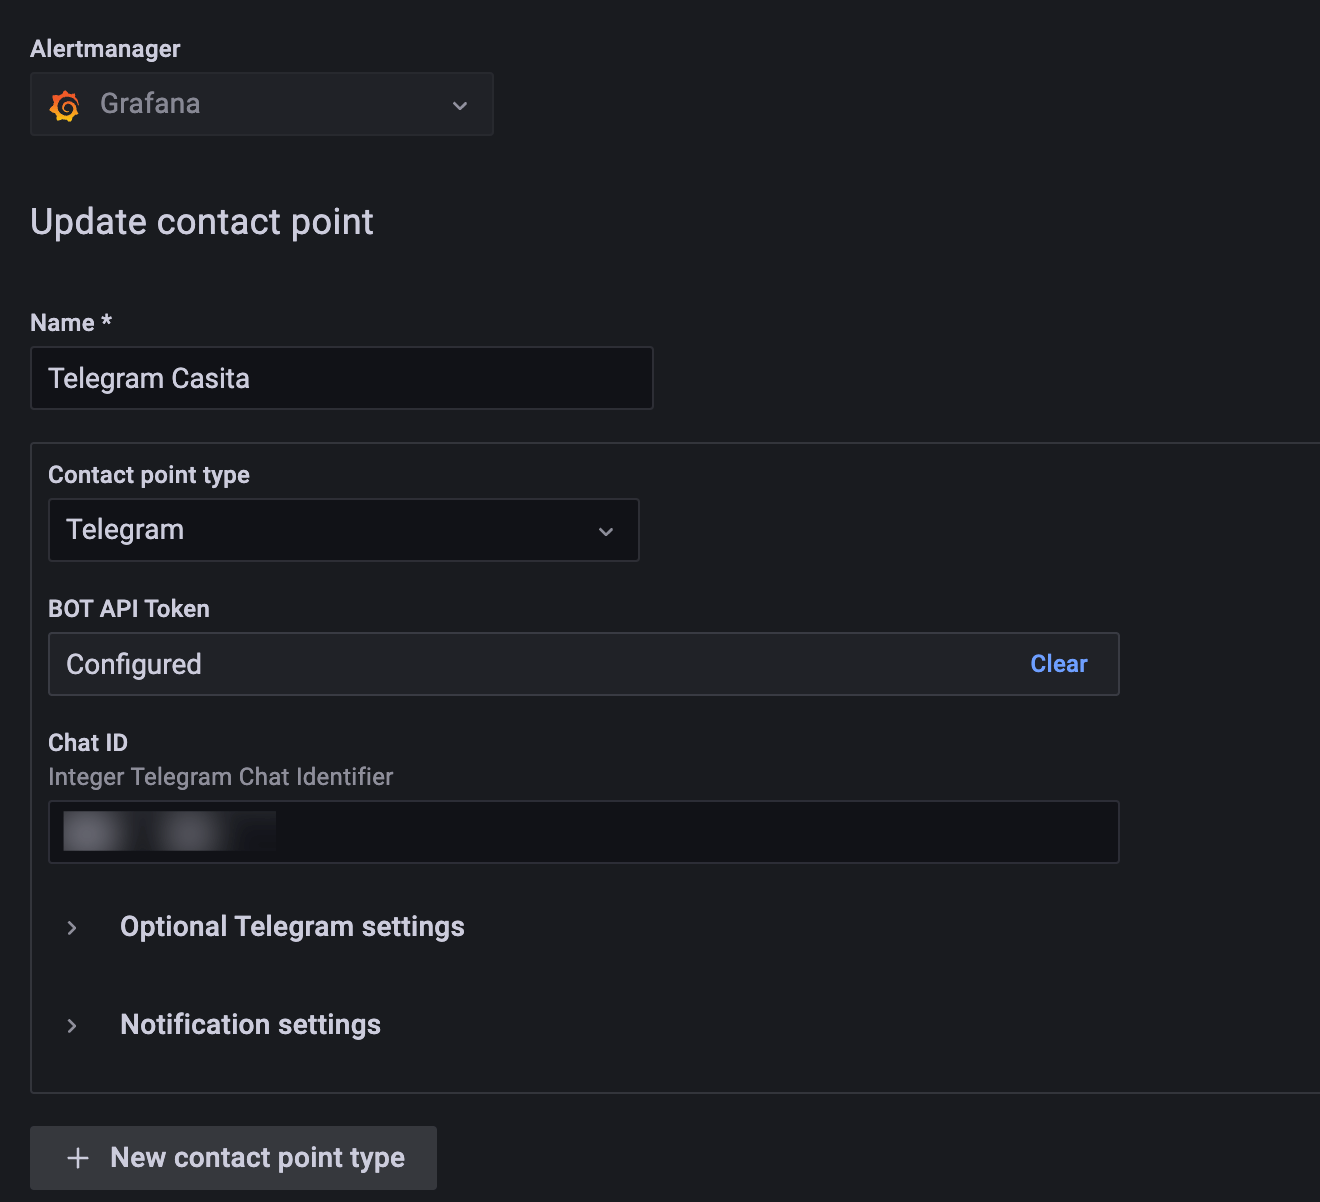
Now go to Alerting -> contact points and add a new Telegram (or whatever you want) as a contact point. If using Telegram you need BOT API Token and the chat ID, how to get those are not the scope of this already way too long post.
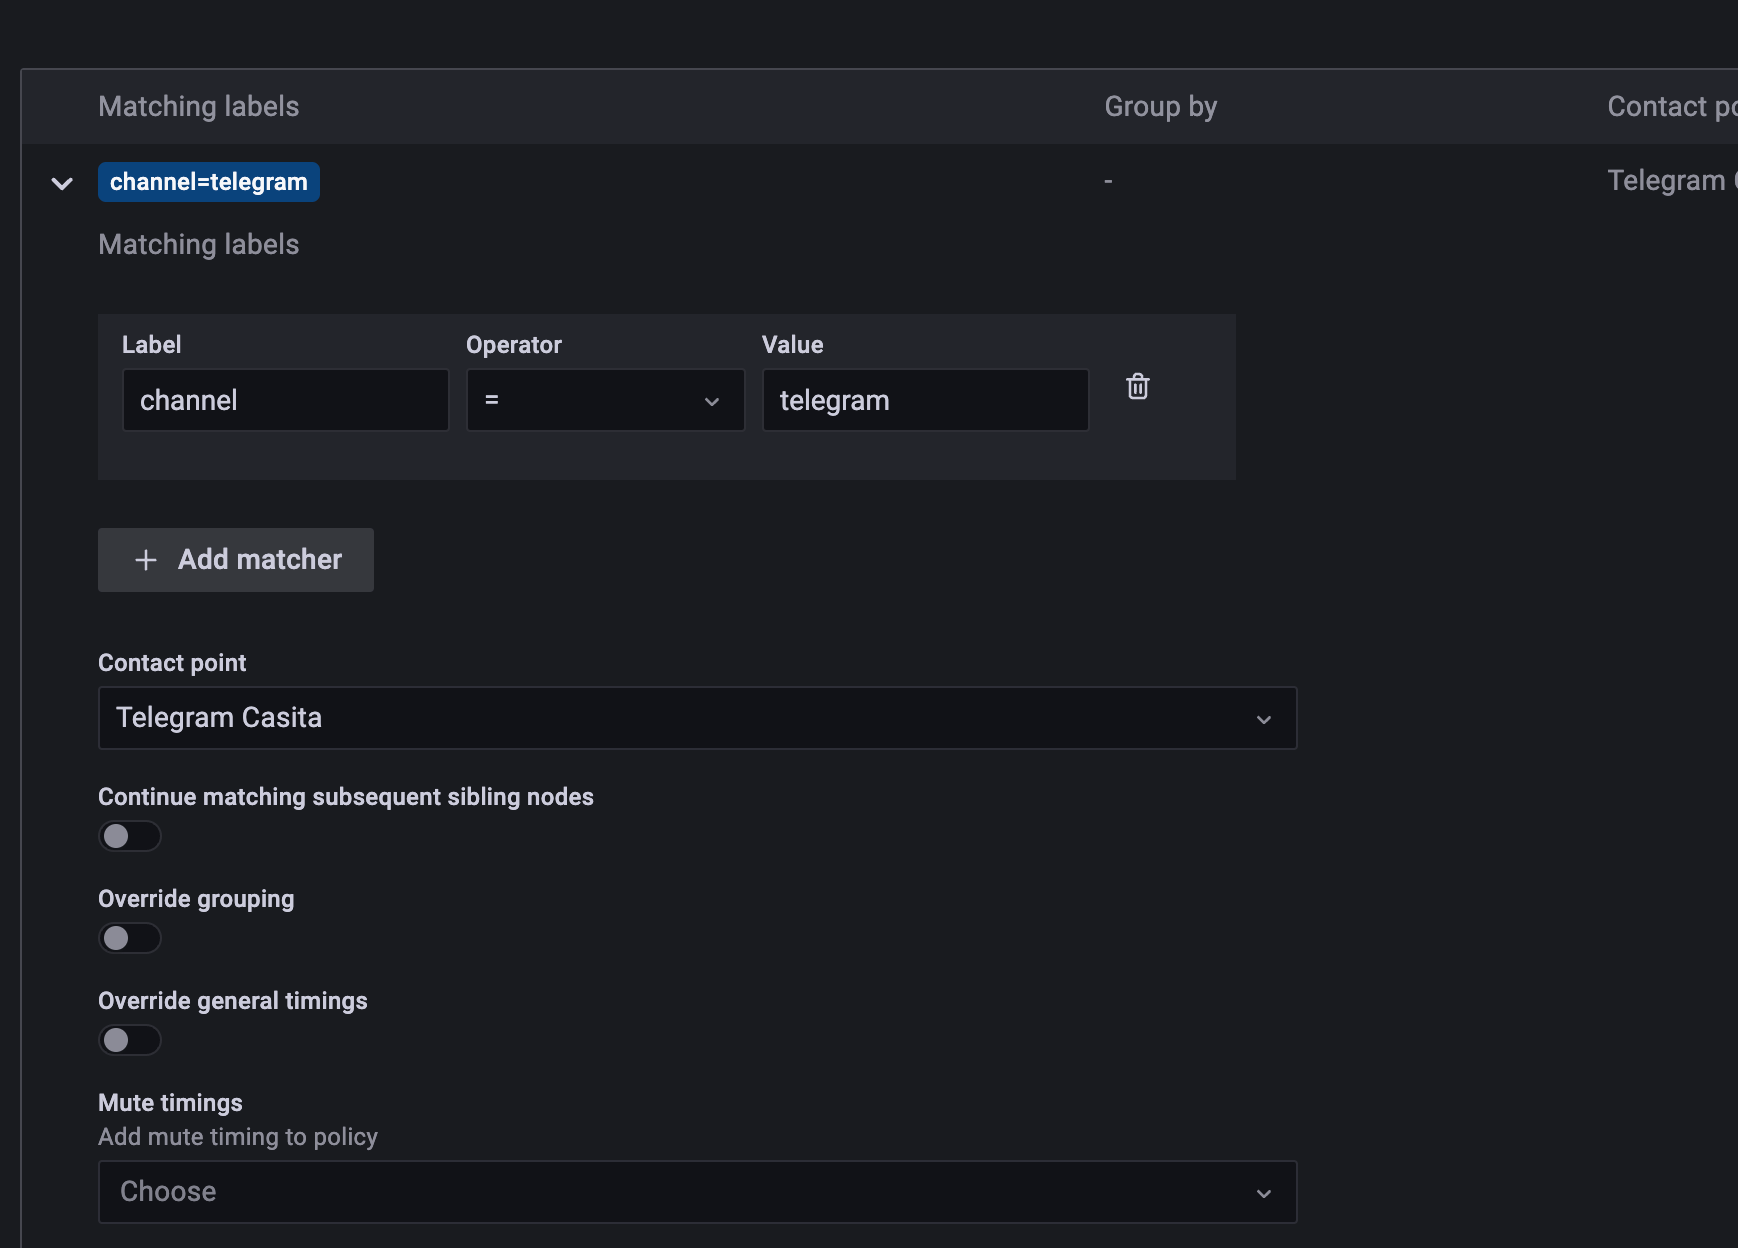
Now Notification Policies in Grafana and create a new policy to use this contact point in case the channel label is equal to telegram.
One more thing that was not covered here is how to configure Grafana’s URL. All alerts will have localhost in the URL for silencing for example. But this should be just an ENV var in the compose file. For me, this is already enough to know which battery needs changing.
Warp Up
And that’s a warp! I hope I didn’t forget anything, tried to take notes while setting everything up. A huge thank you goes to freol for creating the ltss integration! You can find freol on github